
In the previous blog, we looked at examples of FPS measured using GameBench tools and how they can be interpreted to understand the quality of a gaming session objectively. Before going into additional metrics and how we can spot good/bad gaming sessions, it's a good time to dig into some of the more complex nuances in game testing — janks and frametimes.
Both of these metrics are computed based on the frame timestamps that are stored in the web dashboard. These additional metrics are only available for Android devices for now.
Janks
What are Janks?
For every frame that is rendered on an Android device, the GameBench tools can capture the timestamps for the “start” and “finish” of a frame. Ideally, the difference between the start and finish of a frame (aka. frame latency) should be less than 16 ms in order to maintain a smooth 60 FPS. The Janks metric is computed as follows,
Latency = Difference in time between the start and finish of a frame in milliseconds
Vsync period = 1000ms/(Display Refresh Rate usually 16ms)
Intermediate Value = Ceil( Latency/(Vsync Period) )
Where Ceil is the Math Ceiling function.
The intermediate value mentioned above should ideally be 1 for a game that is rendering at 60 FPS and 2 for a game that is rendering at 30 FPS. If the value jumps between 1 and 2 (or a higher number), we call this a Jank.
Now you may ask, what happens if the frame latency goes beyond 16 ms? This can result in two things:
- You might miss the deadline of rendering to the display at 60 Hz. In modern mobile devices, the operating system has triple buffering so a latency of more than 16 ms will not lead to frames being lost as long as it's occasional. To know more read this slightly old blog, but still relevant for Android.
- Touch (UI) responsiveness suffers if you spot Janks in the Performance charts (indicated by a black line).
How can you record Janks?
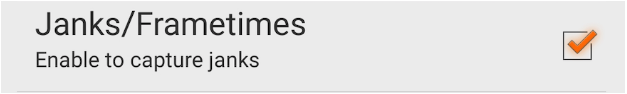
At the moment, Janks can only be recorded on an Android device (we are investigating feasibility in iOS devices). In order to enable Janks, you need to be a GameBench licensee and use either the Android or Desktop app. When using the Android app, please go to the settings of the App and check the setting shown below. Once enabled, Janks will be recorded and displayed in the Performance Pane for the web dashboard.
Frame Times
How do you measure frame times?
To record frame times on the Android app, you need to enable “Janks/ Frametimes” in the settings of the GameBench Pro app. The latest version of the Desktop App has frame times enabled by default.
Once the recorded session is uploaded to the web dashboard, you can download the data using the GameBench API. Big Fish Games, has published an open source python library to get all the data that has been uploaded to the GameBench server. At the time of writing this blog, the library needs a small modification in order to retrieve frame times using the endpoint documented here. More details on the API output and interpreting the data is mentioned in the latter section.
When can you use frame times?
Frame times for a gaming session are incredibly useful to find out issues that FPS might miss. Let's look at the following scenario which might need for more detailed information.
Scenario1 (Game1): Median FPS 30, FPS Stability 79%, Variability, 3.1
Scenario2 (Game1): Median FPS 30, FPS Stability 85%, Variability 3.5
Both the above scenarios look like good gaming scenarios, but while testing the game you notice that Scenario2 was playing worse compared to Scenario1. This is something we are working on to detect automatically for you, but in the mean-time, if you would like to perform some analysis yourself frame times for both sessions are where you should start.
Frame rendering pattern
Before we go into how frame times can help, we need to understand how frames are rendered for games with a Median FPS of 30.
As mentioned earlier, a 30 FPS game should render a frame to the display once every 32 ms. Because FPS metric takes the total number of frames rendered in a second, we sometimes miss out valuable information on the time stamps when each frame was rendered. In the ideal world, the display refreshes once every 32 ms. But we can have a scenario where we render 25 frames at 32 ms, 3 frames at 48 ms and 2 at 16 ms. This would still lead to 30 FPS but the gamer is likely to experience stutter during his/her session. This is exactly where frame times can help spot issues.
For a 30 fps game, the picture below shows the ideal distribution of frames.
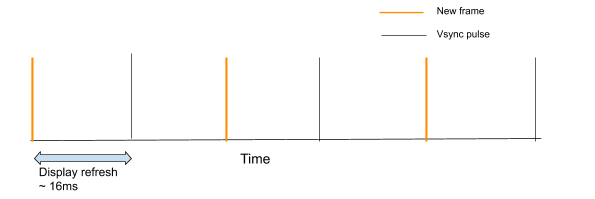
As you can see from above a frame should be rendered for every alternate “pulse” (orange line shows a new frame rendered on display) so the user doesn't perceive any stutter. Any changes to this pattern for a game that is targeted to run at 30 FPS can cause a sub-optimal experience for the user. We can detect this pattern easily using the frame time data from GameBench. This data is available only via our GameBench API currently. We are getting feedback from our customers on the best possible way of visualizing this and any feedback you have is valuable. For the time being though, you can see an example of frame time analysis using the GameBench API below in the “Example Sessions” section.
Interpreting response from frame times API
The frame times API has the following response if a session has been recorded with Frametimes enabled.
As you can see, the response contains an array of objects with each object in turn containing an array of values for “drawStarted”, “drawFinished” and “lastVsync”. The description of all the fields in the JSON response is documented below,
- vSync - display refresh of the mobile device in nanoseconds (16 ms for a 60 Hz display)
- val1, val2, valn - Timestamps in nanoseconds. The number of values (n) in field are the same. i.e drawStarted, lastVsync and drawFinished all contain n values.
- drawStarted - Timestamp when a frame started processing
- drawFinished - Timestamp immediately after that frame completed and was sent to the display hardware (Note: This will be displayed when the next vSync pulse occurs)
- lastVsync - The vsync timestamp immediately preceding the frame being submitted to the display hardware
Note on Janks
The difference between drawFinished and drawStarted is frame-latency. An interesting data point is when the frame-latency crosses a refresh period (vSync period) boundary. This can be calculated as follows:
val = ceil( (drFin -drStart)/refresh)
Where
drFin - timestamp drawFinished
drStart - timestamp drawStarted
refresh - refresh period (16 ms)
Where ceil is the Math ceiling function. Each time this number (val) changes, we have a “Jank”. If this happens a lot during an animation, the animation appears janky even if it runs at 60 FPS. This is denoted by the black line in the performance charts when you use the GameBench tools as shown below.
For some advanced visualizations, the first step is to post-process the JSON output so we can get one big timestamp array for “lastVsync”. We can then use the lastVsync values in conjunction with the Markers feature to look at interesting sections of the gaming session.
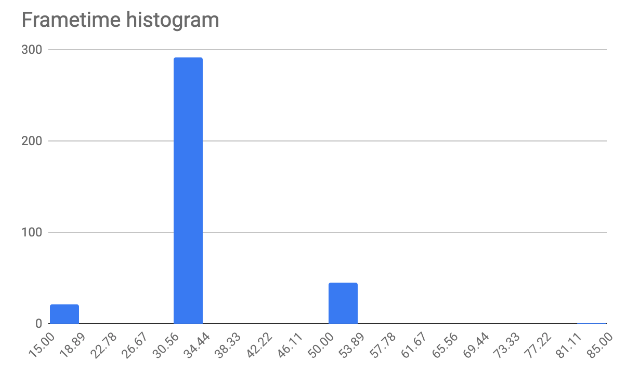
For example, we can retrieve all the frames that were rendered during a “marked” region and compute the histogram of frame times. The following histogram is for a popular racing game (where a game level was marked ~ about 18 seconds). The game is supposed to run at 30 FPS, but upon closer analysis, we can see that a good proportion of frames outside the optimal time (33 ms for 30 FPS). In this case, a number of frames (~50) took 48 ms to render. This might affect how the user perceives the game especially if the content is dynamic.
Example sessions
In this section, we will look at some of the gaming sessions in the web dashboard and will use the information in this blog to assess their quality.
Session 1: Minion Rush on the Honor 10
The session can be found here. We have discussed how we can interpret this session based on the fundamental metrics of game animation in the earlier section.
Now, if we dig a little deeper into frame time histogram for Run2 , we get the following.
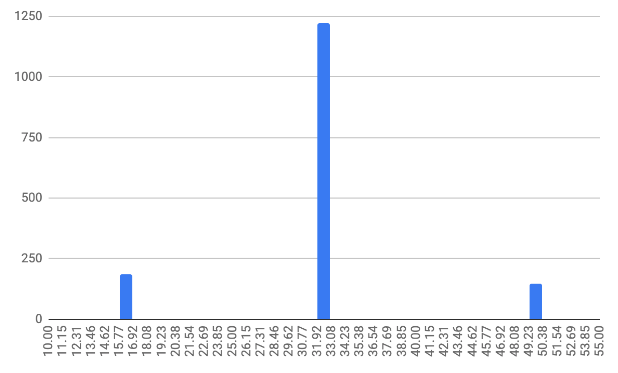
Points to note:
- 20% of frames (330 frames) do not render at a latency of 33 ms.
- 10% of frames take 51 ms to render. This can potentially be an area that could be focused upon by the developer to give the gamer a smoother experience. Its worth noting that for a dynamic game the time spent on optimizing the performance is likely to give a better experience, but might not yield any significant improvement for a game in another genre.
Session 2: Subway Surfers on Honor 10
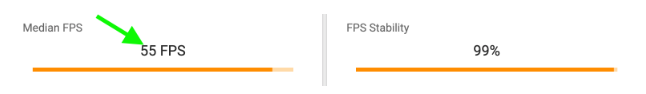
The session can be found here. We have used markers on this session. Looking at the summary below, we can see that at first glance, it looks to be a average session. Average because the game is supposed to be a 60 FPS game but the session median FPS is 55 even though the FPS stability looks very good at 99%. This indicates that we need to have a closer look at the performance data.
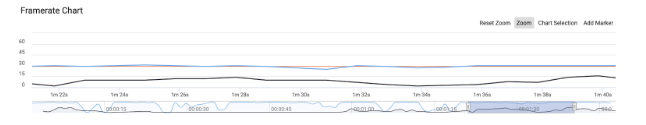
The framerate chart for the session is below.
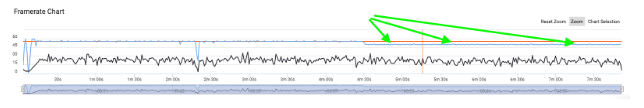
Key points to note in the above chart,
- The session until 4min 30s runs at 55 FPS and then drops to 50 FPS for the rest of the game (as shown by the green arrows).
- You can also notice that there are a lot of Janks (black line) and this is probably causing the frame rate to not hit 60 FPS. This is also likely to affect latency for touch inputs. The game doesn't need constant interaction so input latency might not be such a big consideration.
This session will pass as an average session but there is certainly scope for digging deeper.
What Next?
Frame rate and frame time analysis using tools like GameBench can provide critical data on game quality for the benefit of Quality Assurance teams, development teams and product managers. If you’d like to get some data for your own chosen games or devices, please download the GameBench Community Edition (free) or use GameBench Pro (paid) for Android, or the GameBench Desktop App (paid) for Android and iOS.
