In the world of mobile gaming, there can be no doubt that performance matters. It's no coincidence that top studios like Supercell and King make games that run smoothly even on older and weaker devices! Being able to optimize a game for the best possible user experience across the widest possible range of hardware is key to commercial success.
The GameBench Pro Desktop App gives studios the ability to manually record test sessions and capture performance metrics that can analyzed in our Web Dashboard by development teams to diagnose issues and/or optimize performance of games on any device.
At this point, you might be saying…“Great, but without added value and intelligence, more data only equals more effort and more problems.” And we hear you!
In this post, we will explain the metrics GameBench measures and give you an idea of what to look for in all this data in order to make better decisions about your product. We’ll also recommend some actions you can take to solve common problems you might find in the data.
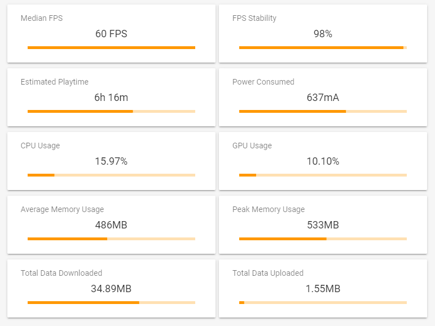
GameBench Pro gives you the ability to record metrics for the following performance categories:
- Frame Rendering
- CPU Usage
- GPU Usage
- Network Usage
- Battery Usage
Each Category has metrics and charts that are accessed on the Web Dashboard under Session Summary. You can dive deeper into each of these high level metrics by clicking into the tab to review sessions for performance problems and diagnose possible causes.
Frame Rendering
Frame Rendering is one of the most critical performance metrics because it measures what the viewer sees while playing your game. It is measured in GameBench using several aspects of Frames Per Second or FPS. Specifically, Median FPS, FPS Stability, and Variability Index.
There are no one-size-fits-all thresholds for frame rate. On PC and console games, however, 30fps is widely considered a minimum for smooth playability, while 60fps is considered a more premium target, and these standards are often used in mobile gaming too.
On the image below you can find FPS comparison of a game recorded on different devices. The orange line on the graphs is the session median FPS.
Consider these fluctuations around the median value in the first sessions and how smooth the second session appears. That's what FPS Stability and Variability metrics represent.
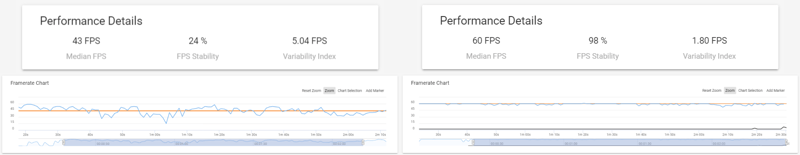
When frame dips below the developer’s target for sustained periods, users can begin to notice stuttering images and lag in the game.
But since this is a median, describing the typical frame rate across a whole session, you will still want to keep a close eye on the Stability and Variability metrics. These will tell you if you have wild swings in FPS values or if they are consistent throughout your session. If you have a good median, but still see low stability or high variability, then this is a predictor that there’s performance bottlenecks in your game that need to be isolated and ironed out.
CPU Usage
CPU Usage measures the average load on the CPU across the whole recorded session.
High average usage is a predictor of high power consumption and thermal throttling, which can really hurt user experience. What constitutes “high usage” really depends on the nature of the game and the device it’s running on. Some Samsung phones struggle when average CPU usage exceeds 12 percent, for example, but that doesn’t apply to all devices.
Our GameBench Labs consultancy service works with many top game studios, offering tailored thresholds to set meaningful KPIs and guide their development and QA.
GPU Usage
This is an essential predictor of user experience problems in games because it measures the demand that a game’s software makes on the graphical processor. Too much spare headroom perhaps means that you're not delivering the same level of graphical lushness as your competitors. Too little headroom and you're probably being too ambitious and risking a poor experience.
Vertex rendering
Represents the operating load for rendering the scene geometry.
Pixel rendering
Shows the operating load for rendering each pixel in a scene, such as textures and other art assets.
In either case, excessive demands can lead to noticeable problems like unstable frame rates, micro-stutters, and high power consumption. One way to reduce these problems might be to reduce the GPU’s workload, for example, by downgrading certain art assets in the game. Again, setting the right thresholds for healthy GPU load depends on the game and the devices in question.
Network Usage
Nowadays, almost every game relies on an internet connection, so network usage has become a key metric when evaluating performance and power consumption.
High network usage can cause slowdowns, prolonged wait times, unexpected data plan usage, and excessive CPU and battery usage. Optimized network usage, for example in the pattern of uploads and downloads, can ensure your app is less data-hungry than a competitor’s as well as making your game less susceptible to connectivity bottlenecks.
It’s often a good idea, for example, to break up large bursts of data into smaller chunks spread across a gaming session, such that only get the data needed for the next screen or gameplay stage gets downloaded in each burst -- rather than trying to download everything in one go at the start of a session..
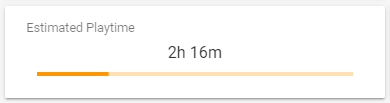
Battery Usage
No user wants to see their battery life plummet while playing a game. GameBench measures Battery Usage using two metrics:
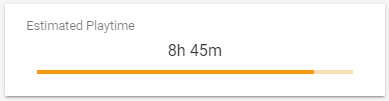
Battery Drain
This is measured as the difference between your battery percentage from the start to the end of your session so we can predict an estimated playtime value for a device.
😀  |
😡  |
This is the battery usage that your user sees from the symbol on their phone and which affects their perception of your game.
Battery Consumption (on supported devices)
This is measured in milliamps used during the session. It goes hand-in-hand with the physical battery size (in milliamp-hours) to allow a more engineering-grade prediction of gameplay time.
Users have different expectations of battery drain for different genres of game and different devices. In reality, studios often set their thresholds of battery usage based on benchmark or rival games made by other studios, to ensure that their games are not falling behind their competitors.
Again, "Now what?"
Download a Sample Performance Comparison Report, In it, we provide an in-depth comparison of two of the most popular mobile games in the world. The report details how these two high-fidelity games performed when tested on two flagship test devices - iPhone 11 Pro Max and Galazy Note 10+.

If you're a game developer or publisher, you can schedule a demo of the GameBench Pro tool with a Product Specialist. They will help cut to the chase of how the tool can improve your workflows.

Alternatively, if you'd rather access GameBench intelligence as a service, in which all testing and reporting is done for you, then arrange a call with GameBench Labs.
