Mobile developers are frequently told that excessive battery drain is one of the key reasons why users abandon apps. But much less is said about how a developer can avoid this problem and ensure that their app is energy efficient.
GameBench is one of the easiest ways to gather power metrics that are both reliable and immediately useful for optimisation. In this article we’ll go through the basic steps of how to get these data , using YouTube and Netflix as examples.
Step 1 - Setting up a test device
For good power readings, it’s best to install the GameBench Android app on a recent device that is based on either a Qualcomm Snapdragon or Samsung Exynos chipset, because these chipsets directly report system power consumption without relying on the (mostly unreliable) battery readings reported by the Android OS.
Note: Once you’ve got hold of your test device, you can get the GameBench app (along with full download and setup instructions) right here.
Step 2 - Defining settings
To achieve meaningful results across multiple tests, it’s important to define some settings which will remain fixed.
These settings should cover GameBench’s profiling options so that GameBench’s own power overhead is kept constant. For our YouTube and Netflix tests, we turned off screenshots but kept everything else (janks, thread usage etc.) on, which keeps GameBench’s own overhead down to less than 90mW (as measured on an HTC 10).
Defined settings should also cover the apps that are installed on the phone and the settings for those apps. In our tests, we had 14 user-installed apps, plus some carrier bloatware that couldn’t be removed (particularly from the Verizon GS7).
Lastly, you should also set the test device’s own settings. In our tests, for example, we streamed everything over 4G on the same carrier network, with WiFi and Bluetooth turned off, and with display brightness visually matched across devices.
Step 3 - Gather and analyse the power data
Okay, here comes the interesting part! Once GameBench is running on a properly configured test device, it’s simply a question of using (or playing) your test app for a meaningful length of time -- ideally a duration that reflects average real-world usage of the app.
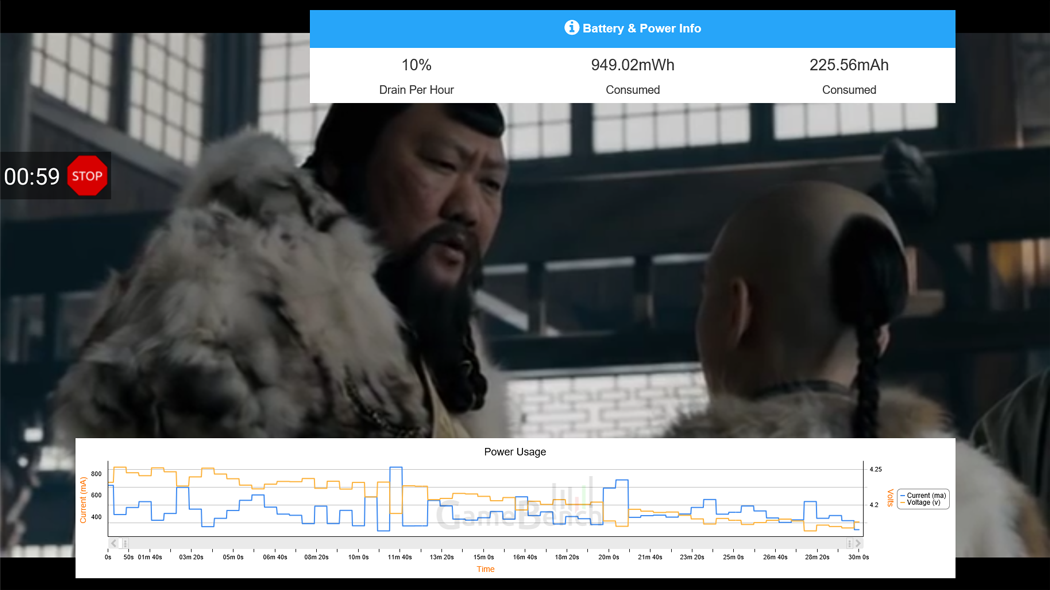
On YouTube, we streamed 30 minutes of an episode of the Angry Joe Show with the auto quality settings, and on Netflix we streamed Marco Polo: One Hundred Eyes (also around 30 mins long), again with the auto quality setting. We repeated these tests on four different Android devices: the LG G5, HTC 10 and both the US and European versions of the Samsung Galaxy S7.
Session data is synced to the GameBench web dashboard after each test, allowing instantaneous power to be visualised as a chart showing current and voltage:
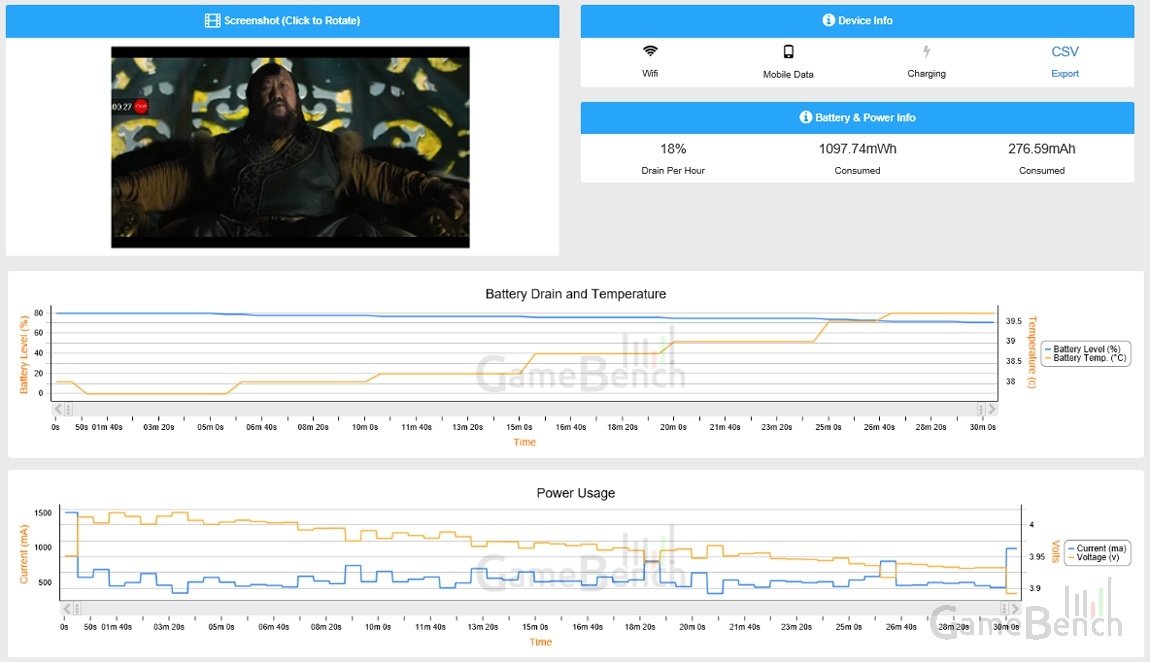
In turn, these metrics can be summarised as a single number: average power consumption (in milliwatts) across the whole session. Putting this summary figures into a table quickly yields the type of conclusions that may be of use to a developer:
| Power consumption of streaming apps on various devices (mW) | ||||
| App / Device |
HTC 10 |
LG G5 |
Samsung GS7 (US) |
Samsung GS7 (UK) |
| YouTube | 2059 | 1934 | 2248 | 1430 |
| Netflix | 1898 | 1826 | 1946 | 1260 |
For a start, we saw big differences across devices, with the UK variant of the GS7 demonstrating much better power efficiency than the HTC 10, LG G5 and the American GS7. This sort of preliminary information cannot pinpoint the causes of the differences -- these could stem from chipset differences, LTE / network differences, or from some other uncontrolled variable (such as the precise amount of data that was streamed). However, these preliminary data can enable further investigation which in turn permits better app optimisation. For example, apps could be made to stream at different default quality settings to compensate for inefficient LTE streaming on certain devices.
Secondly, we saw that YouTube was generally the more power hungry of the two apps. Digging deeper into GameBench’s metrics reveals that YouTube is also sucking up a lot more network traffic than Netflix (380MB on average, versus 120MB) on its auto quality setting, which could well be causing the extra wattage. It’s essential to know these metrics in order to strike the right balance between visual quality, network traffic and power drain.
Finally, now that we’ve set some initial healthy ranges for the power draw of these apps (generally around 2000mW), a developer can more easily spot red flags -- i.e. sessions that are outside of this normal range and hence need to be looked at. For example, the US GS7 YouTube session would be red-flagged because it's more than 10 percent beyond our healthy range, and this might be the only session that a QA manager is interested in. By investigating further, the QA manager would discover that this session came from a US device running on a UK network (i.e. not a very common predicament, or one that will affect many users), and then they could decide whether or not the session can be safely ignored.
Note: Outside of this particular streaming test, if background apps are not a controlled variable, then it may also be worth using ADB to identify background processes that are hogging the CPU (an ability that we will soon add into GameBench itself). It very often turns out to be Skype, or some carrier bloatware, that is causing the excess power drain, rather than the app being tested.
Measure your own app
We’ve seen how easy it is to collect accurate and meaningful power metrics that can help to guide the optimisation of an app. If you want to try this with your own mobile product, head over to our Download page to get started!