Intro and summary
GameBench is very different to other mobile benchmarks, because it is designed to measure the performance of mobile devices running real workloads. These workloads are simply apps — the very same apps and games that ordinary smartphone owners download and run every day.
Most benchmarks used in the mobile industry today are synthetic, which means they test artificial workloads that are never encountered by real customers and can at best only approximate real-world usage.
Each type of benchmark has its place, but there are three evidence-based ways in which GameBench offers a more useful alternative, and very often a direct counterpoint, to traditional benchmarks:
- GameBench scores show a more accurate picture of what real-world users actually experience with a device, often directly contradicting synthetic scores and better predicting the conclusions of tech reviewers;
- GameBench measures things that everyone can understand, such as frames-per-second and battery drain, whereas synthetic scores tend to resonate with a particular niche of mobile enthusiasts. Moreover, although this article focuses on measuring device performance, GameBench is uniquely able to evaluate the performance of apps and games;
- GameBench points to ways in which performance can be improved, particularly in highlighting performance irregularities and bottlenecks to app developers and hardware engineers, whereas synthetic scores can seem static and absolute.
The role of synthetic benchmarks
The purpose of this article is not to undermine synthetic benchmarks, but rather to highlight that they are being widely misused as a source of guidance for end users. In the coming sections, we’ll show that a higher synthetic score does not equate to better performance at running real apps or games, and indeed synthetic benchmarks often point to the wrong purchasing decision.
Specialist journalists have already cottoned onto this problem and they’re now very careful to use synthetic benchmarks in the right context. But mainstream journalists and marketers have not followed suit. They often present synthetic scores as a simple way for consumers to tell which device is “better” than another — an approach that we can prove is inaccurate.
The true value of a synthetic benchmark is to reveal the technological capabilities of a device, not its real-world usability. It does this by defining a perfectly repeatable workload that is has been deliberately designed to stress the device in specific ways. A good benchmark, such as 3DMark, will focus on a type of performance that is of interest to people who care about a specific area of technological progress —such as 3D graphics— rather than people who simply want to advice on an upcoming phone upgrade.
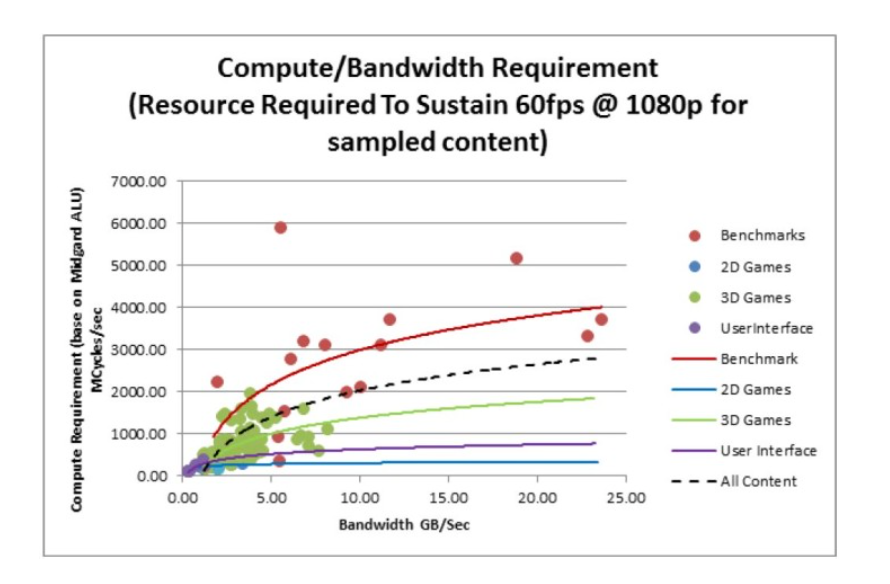
The theoretical nature of synthetic benchmarks is illustrated in the graph below, collated by ARM and copied from Android Authority, which shows that their computational requirements are on a totally different level to what is required by real workloads:
Example 1: HTC across the generations
If you look scores from AnTuTu and GFX Bench (two of the more popular synthetic benchmarks) for the last three generations of HTC’s “One” smartphone, you get the impression of big, linear leaps in performance. This is not necessarily surprising when you recall that HTC has been shown to “optimise” its devices specifically to show exaggerated benchmark scores (and therefore, presumably, a greater incentive to upgrade):
By contrast, GameBench records frame rate and frame rate stability over the course of a 15-minute playing session with a real game. These measurements cannot be manipulated or optimised except in a way that benefits real gamers. If you take GameBench’s frame rate scores for HTC devices playing Asphalt 8 (a very popular racing game), then the picture is much less neat and tidy. GameBench shows that performance hardly changed from the M7 to the M8, giving consumers less of a reason to upgrade until the M9 came along:
Then again, one of the advantages of GameBench is that it also measures real-world battery usage. This shows that someone upgrading from the M7 to the M8 would have enjoyed some benefit after all, in the form of better power efficiency. They’d have then lost this benefit if they upgraded to the M9, whose battery life took a step backwards:
What’s especially interesting about GameBench’s results it that they’re a much better predictor of what reviewers actually say about these phones, based on their own ad hoc measurements or subjective impressions. They said that the M8 brought better battery life compared to the M7:
"The brand is claiming that it's managed to pull 40% longer battery life with the One M8 compared with last year's model, and that claim seems to hold water." — TechRadar
They also said the M9 brought better performance compared to the M8:
"We tested the HTC One M9 with some of the most demanding games on Google Play… we didn’t experience a single frame drop, unlike the One M8 where we have had a few." — Trusted Reviews
And they agreed that the M9 had disappointing battery life:
“In real-world use, we found the M9 was equally disappointing. With even moderate use, we found we regularly needed to recharge before the end of the day… In contrast, the HTC One M8 regularly lasted us into a second day of use.” — PCPro
Example 2: Ranking the best GPUs
Next, we’ll look at an even more extreme example of a disparity between synthetic and real-world benchmarking. Specifically, we’ll see that the Google Nexus 5 is a device with higher theoretical capability than its peers, but worse real-world performance.
The Nexus 5 is powered by a Qualcomm Adreno graphics processor, and synthetic benchmarks have heavily favoured devices containing this GPU, at the expense of some Mali GPUs from ARM and PowerVR GPUs from Imagination Technologies:
By contrast, real-world gaming across a basket of popular games from the Google Play store* shows that the devices are far more evenly matched, and the Nexus 5 actually lags slightly behind the supposedly less capable PowerVR-based Galaxy S4:
Lastly, if we take power consumption into account, then the Nexus 5 suffers even more. The Mali and PowerVR GPUs in this generation of devices tended to sit alongside octa-core CPUs, including those based on ARM’s big.LITTLE design. These octa-core devices actually had a significant advantage over the quad-core Qualcomm CPUs in terms of power consumption:
Overall, Qualcomm’s GPU advantage isn’t as big as synthetic benchmarks make out and it appears to be undermined by worse power efficiency of the SoC as a whole. This begs the question: What’s the point of a device that offers greater theoretical capabilities, but which performs no better at real-world tasks and drains more energy in the process?
(*There were 15 games in this test basket: Asphalt 7, Asphalt 8, CSR Racing, NFS: Most Wanted, Riptide GP2, Temple Run 2, Minion Rush, Bladeslinger, Bombshells, Shardlands, Dead Trigger 1, Dead Trigger 2, Fifa 14, Deerhunter 2014, Plants vs Zombies.)
Example 3: Developer engagement
Synthetic benchmarks contain an inherent assumption that hardware, rather than software, is what matters most. GameBench reveals that this is not true. For example, the Samsung Galaxy S6 cannot play Asphalt 8 at anything higher than 30fps — but is this due to software or hardware limitations?
GameBench reveals that the Galaxy S6 plays the game with an average GPU usage of just 60%, and it maintains a very high frame-rate stability of above 90% — all of which suggests that the device is coping easily and could be pushed harder. This raises the possibility that the GS6 is not being limited by its hardware, but by an arbitrary frame rate cap put in place by Asphalt 8’s developer, Gameloft.
On the other hand, the GS6’s GPU usage occasionally (but rarely) peaks at 100%, which shows there are some specific visual effects in the game that totally max out the hardware — so perhaps Gameloft is justified in employing a frame rate cap to maintain smooth performance?
Either way, this 30fps cap could be resolved through cooperation between the developer and the hardware company, using GameBench data as the basis for discussion. Ultimately, if all corners of the mobile ecosystem can agree on a common framework for evaluating real-world performance, it will be easier for them to work together to improve this performance over time.