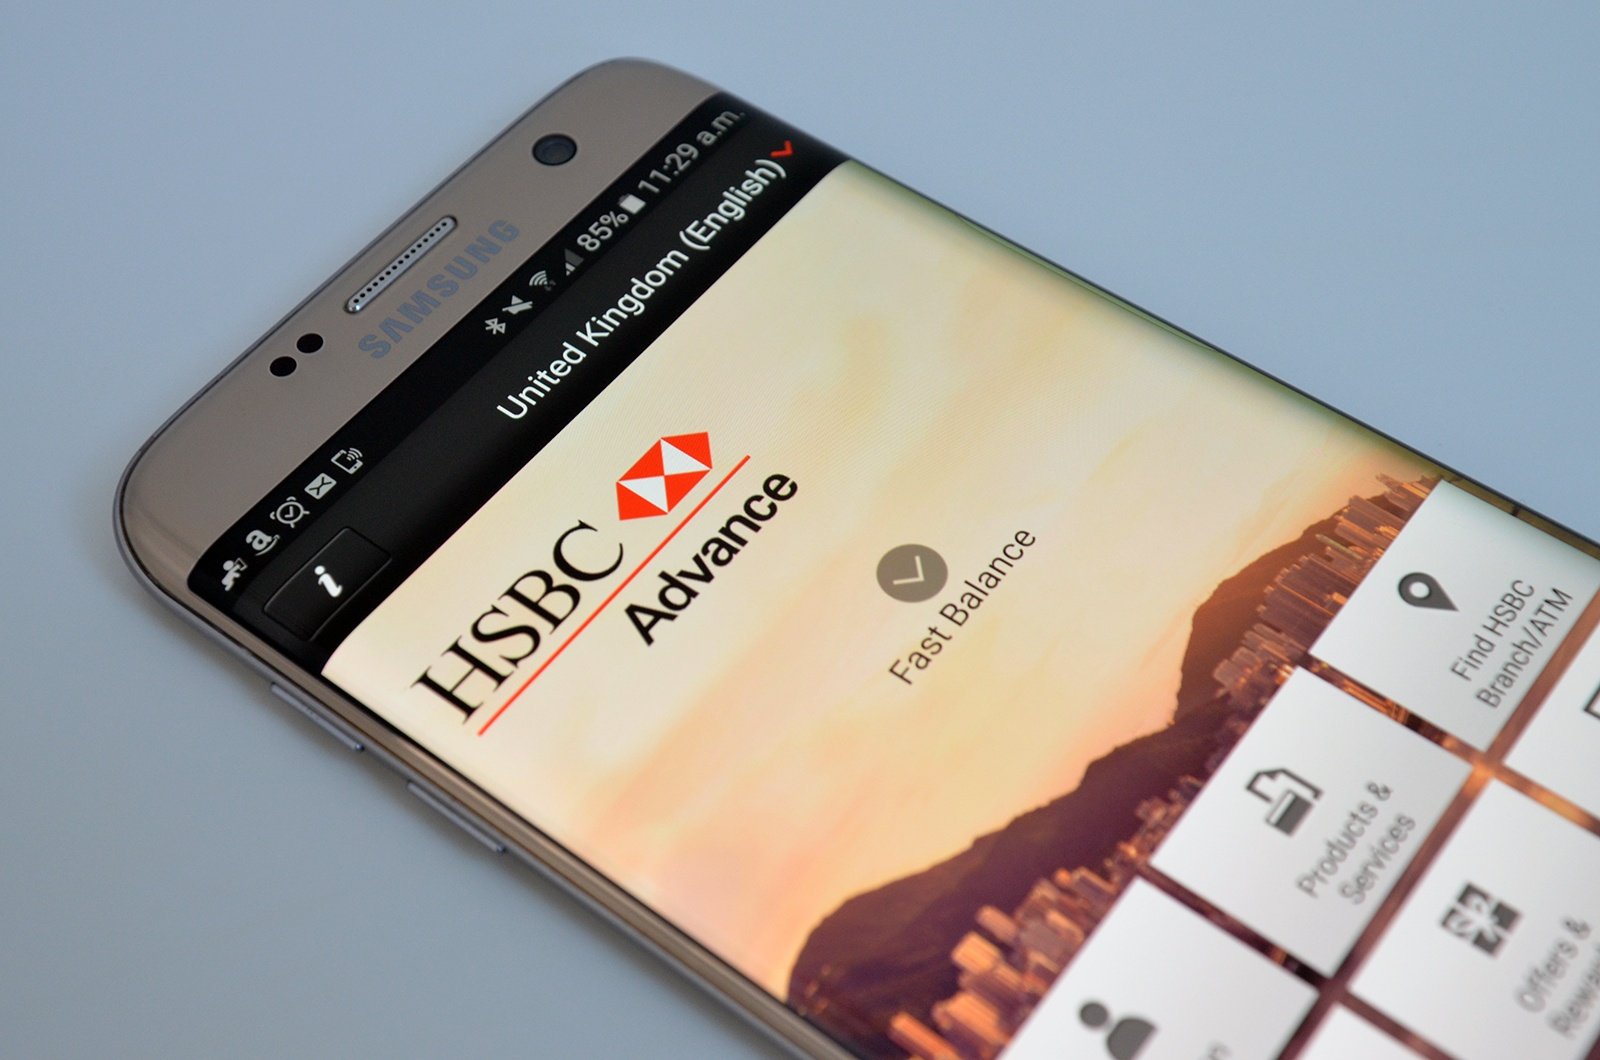
Which of these two tasks is more likely to exceed the limits of your smartphone: checking your account balance on the HSBC app, or playing Angry Birds 2?GameBench makes it easy to discover the answer with just five minutes of testing on each application, and the results are surprising.
App vs. Game
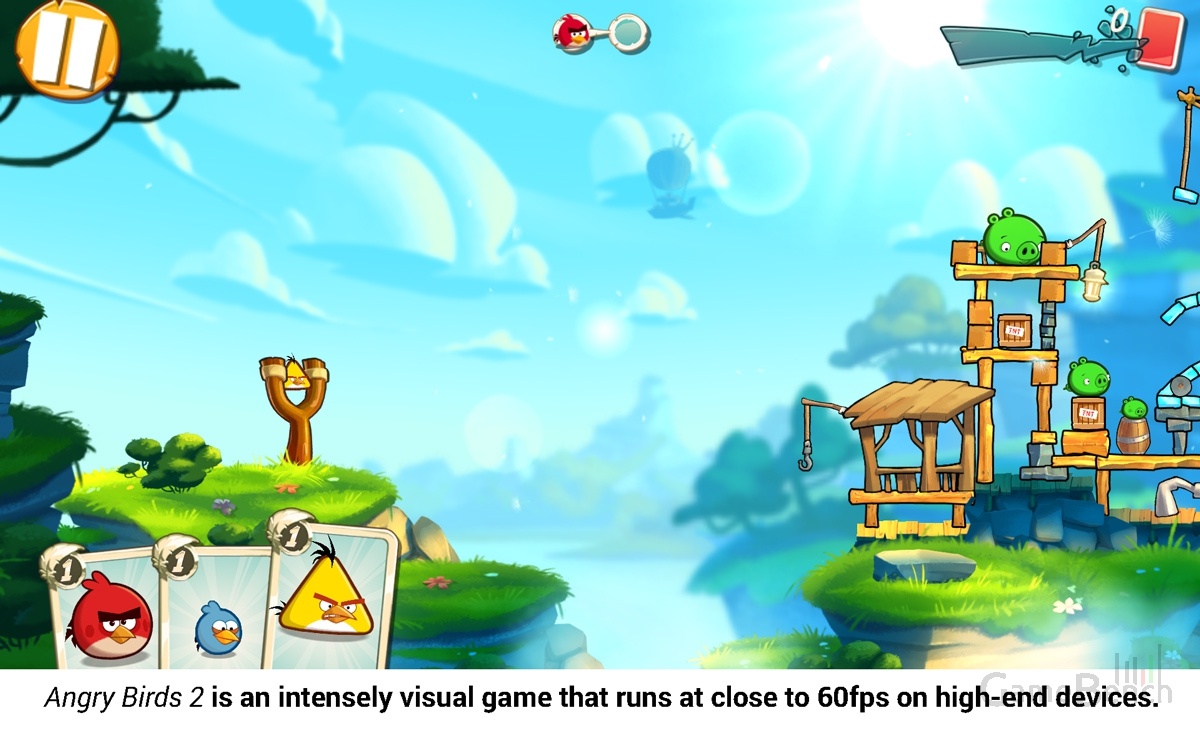
Comparing a banking app with a game isn’t as strange as it might seem. The HSBC app and Angry Birds 2 have something important in common: they both aim to deliver the best possible visual responsiveness and smoothness, so they both target a graphical animation rate of 60 frames per second (fps).
Explainer: Frame rate objectively measures the smoothness of animations. Android and iOS applications generally target either 30fps or 60fps.
Of course, each application targets 60fps for a different reason. The HSBC app does it to ensure smooth scrolling and swiping, whereas Angry Birds does it make in-game physics appear more convincing. Nevertheless, frame rate is a key objective measurement of UX quality in both cases, so we figured it would be interesting to analyse them side-by-side.
And here comes the surprise: On the Samsung Galaxy S7 (a flagship Android phone),Angry Birds 2 actually stayed much closer to its 60fps target than the HSBC app did. We tested the first level of the game and observed a median average of 59fps. Meanwhile, scrolling through recent transactions in the app frequently caused visible stutters and had a median average of 51fps. In other words, even our top-end phone couldn’t quite deliver an optimal HSBC experience -- and it's hard to blame the phone.
Now, we’re not saying that the HSBC app is broken. It works pretty well and no bank customer is likely to storm out of the room just because of some glitchy scrolling. Then again, as we’ve reported in previous studies, there’s strong evidence that users associate imperfect visuals with poor quality, and they expect well-known brands to have a seamless, highly-optimised mobile presence -- that is why Facebook, for example, is obsessive about the 60fps scrolling smoothness of its app.
Bank vs. Bank
Is the HSBC app’s rough scrolling an anomaly, or do other banking apps run into similar UX problems on Android? This was an easy question to answer: all we needed to do was view recent transaction lists on some rival apps and monitor the frame rate while scrolling (or swiping, in some cases). We did this test on two different devices: the high-end Galaxy S7 and the older, cheaper HTC Desire 816.
In addition to frame rate, we also recorded the number of “janks” recorded during a ten-second period of uninterrupted scrolling. Janks are a useful predictor of visible microstutters -- i.e. stutters that last much less than a second and which may therefore be overlooked by the frame rate measurement (which is captured only once per second).
Explainer: Janks occur whenever there is a significant difference between the processing times of two consecutive frames. Janks don't always lead to visible stutters, but they're a good objective predictor.
The results, put into the table below, show that HSBC is something of an anomaly, because the other apps we tested were pretty smooth by comparison. The only real exception was Santander’s Business app, which maintained great frame rates on the high-end device but showed significant janks on both devices and a slight reduction in frame rate on the lower-end phone.
| Scrolling smoothness on Samsung Galaxy S7 | |||
|---|---|---|---|
| App | Max. Scrolling Speed | Min. Scrolling Speed | No. Janks in 10s Interval |
| Lloyds | 60 | 59 | 18 |
| Barclaycard | 60 | 59 | None |
| Santander (Business) | 60 | 59 | 33 |
| HSBC | 56 | 45 | 24 |
| Scrolling smoothness on HTC Desire 816 | |||
|---|---|---|---|
| App | Max. Scrolling Speed | Min. Scrolling Speed | No. Janks in 10s Interval |
| Lloyds | 60 | 59 | 17 |
| Barclaycard | 60 | 58 | 63 |
| Santander (Business) | 60 | 57 | 104 |
| HSBC | 54 | 40 | 101 |
Underlying problems
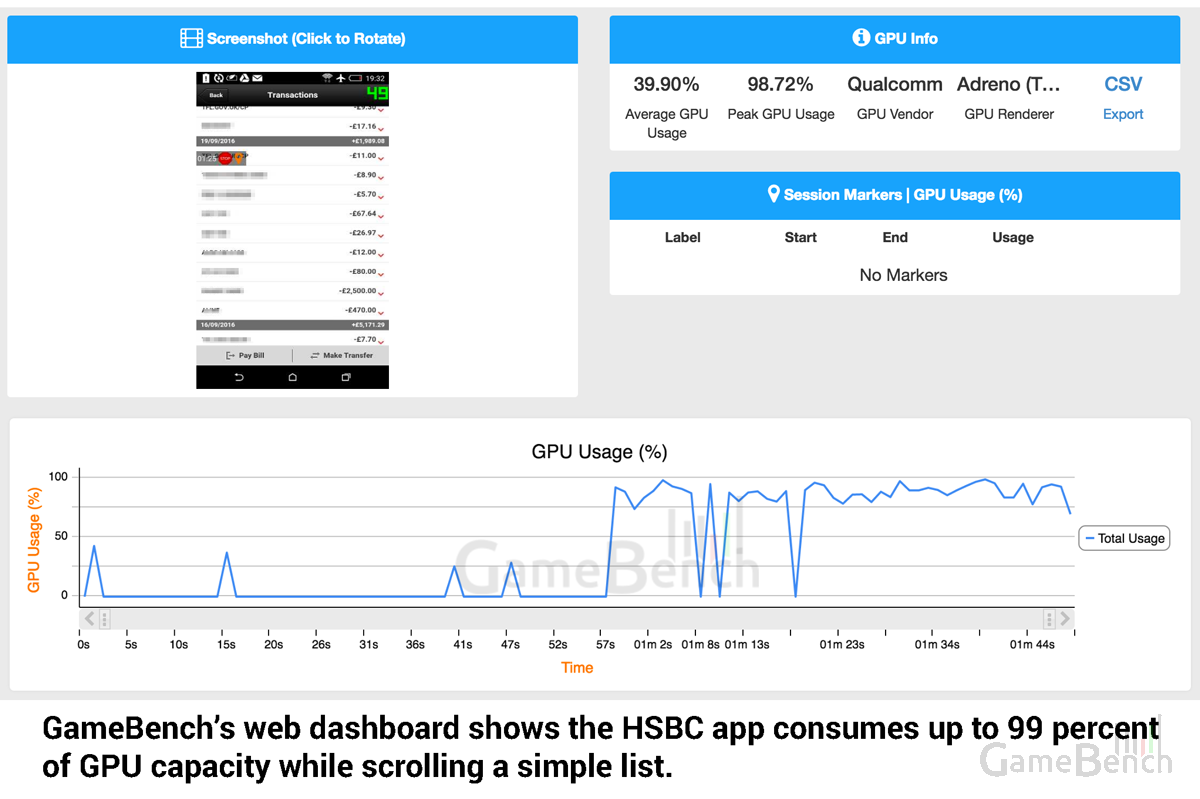
Why is the HSBC struggling to scroll in this way? To answer this, we used GameBench’s web dashboard to analyse the way the app consumes available computational resources. From past experience, we know that apps with poor scrolling tend to misuse the graphics processor (GPU) in a device, perhaps by making it render too many layers of invisible objects, or by making it wait unnecessarily while too much work is attempted on the main CPU thread. We can't pin down the exact reason in HSBC's case without actually debugging the app, but we did at least find some clear abnormalities in the way the GPU is being used.
On our top-end Galaxy S7, the HSBC app consumed a peak of 59 percent of available GPU capacity merely in order to scroll down a table of words and numbers. This is well outside what we’d consider to be a healthy range of peak of GPU usage for such a simple task on this device. Well-optimised apps, including very pretty ones like Amazon Shopping, don't peak above 40-45 percent.
On the low-end HTC Desire 816, peak GPU usage rose to 99 percent during this task -- basically maxing out this component and tallying with the fact that frame rate on this device was even lower. This is another sure-fire indication of inefficient GPU utilisation, because GameBench's crowdsourced data shows there are better-optimised (and again, much prettier) apps out there which only peak at around 80 percent of GPU usage while scrolling on this HTC phone.
The second-worst app in terms of GPU optimisation was Santander, which showed excessive peak GPU usage of around 60 percent while scrolling on the GS7, as well as high average GPU usage on both devices -- which correlates quite well with the high number of janks recorded with this app.
The third worst app was Barclaycard, but this only showed high GPU usage on the lower-end device (where janks were also recorded), and not at all on the high-end device. (Note: Barclaycard did show very poor frame rates and excessive GPU usage while scrolling down PDF statements, but that's a more ambitious task than a simple transaction list so we're not taking it into account.)
| Peak (and average) GPU usage while scrolling | ||
|---|---|---|
| App | Samsung Galaxy S7 | HTC Desire 816 |
| Lloyds | 40 (25) | 63 (43) |
| Barclaycard | 42 (27) | 71 (60) |
| Santander | 60 (29) | 67 (62) |
| HSBC | 59 (32) | 99 (75) |
Focusing on user experience
Users can be acutely aware of visual problems in an app. A quick look at recent reviews of these banking apps at the Google Play store shows that bank users notice this stuff too. For example, a recent reviewer said that the HSBC app needed “smoother animations,” while another said that it “feels sluggish” and another complained about the “rough interface,” saying that rivals apps were “much more smooth.”
The two apps shown by our tests to have the worst graphical optimisation, HSBC and Santander, also happen to have the worst average user score at the Play store -- by quite a significant margin. That’s not to say that the poor reviews necessarily result from bad scrolling or excessive resource consumption, but from our experience bad optimisation in one area tends to go hand-in-hand with multiple problems in other areas too, often with a common root cause.
In HSBC’s case, it’s unlikely that the root cause is general neglect of the app. Instead, the poor optimisation likely stems from the way the app has evolved over time, cobbling together or overlaying various parts rather than being built from the ground-up as one cohesive experience. There are a few tell-tale signs of this, beyond the strange GPU behaviour. For example, there are two different “spinning circle” animations for different sections of the app, and overall look and feel changes considerably between these sections.
Similar indications of a hotchpotch nature can be found in the Santander app, where different onscreen elements have very different resolutions, and some poorly formatted photos look like leftovers from the days before high-res screens. It’s also worth pointing out something else we discovered during our tests, which is that both HSBC and Santander fail to deliver on a basic aspect of security that other, more up-to-date apps deploy as standard: they allow the Android OS to collect screenshots of the app even when sensitive info is being shown onscreen, whereas Barclaycard and Lloyds both prevent this.
Taking all these different sorts of QA issues into account, it's clear that the frame rate and resource usage data we've analysed here are only a couple of pieces of the puzzle. But they’re essential pieces, because they start with user experience (i.e., real people using real devices) and work backwards, rather than starting with engineering concerns in the way that functional and compatibility tests do. After all, the HSBC app has probably passed every traditional QA test under the sun, but that hasn’t ensured that it delivers the UX that HSBC really needs to convey the quality of its brand.
Try GameBench for yourself
Download GameBench for free and you can test your own app, or a rival’s app, within a matter of minutes. You can run GameBench directly on the Android device you want to measure, or you can run it on a Windows, Mac or Linux PC in order to profile any Android or iOS device that you connect over USB.