When you’re on a long flight, have you stopped yourself from playing a mobile game in order to conserve your battery? Have you experienced too many stutters when you play a visually intensive title? Do you think it’d be helpful if you could choose a phone to suit your specific needs, based on public data about how well each model handles the best games and apps?
Smartphone and tablet reviewers try to distill their sense of how well a phone performs, but no matter how good their intentions, their conclusions are inevitably subjective and anecdotal. That’s why a market has developed around benchmarking apps like GFX, CPUBench, AnTuTu etc.
We all know that these apps that are susceptible to cheating by device manufacturers looking for inflated review scores. We know that they rarely include any measure of battery life. We know that they measure the theoretical capabilities of a device, rather than how well it handles real, day-to-day apps and games. And yet we still depend on these benchmarks, simply because there is nothing else.
The industry’s over-reliance on these benchmarks, especially in the Android domain, has led to a provable disparity between what consumers think they’re getting when they buy a device, versus what they actually get. Anandtech discussed the issue with synthetic benchmarks We have presented evidence of this disparity to Engadget and witness it in most of our internal tests. One small example of the disparity is shown below: a graph comparing the performance of two different versions of the Samsung Galaxy S4. According to a synthetic benchmark, GFXBench, the Qualcomm version is the better phone. But, as GameBench shows, this doesn’t necessarily mean you’ll get better performance in a real-world game like Real Racing 3.
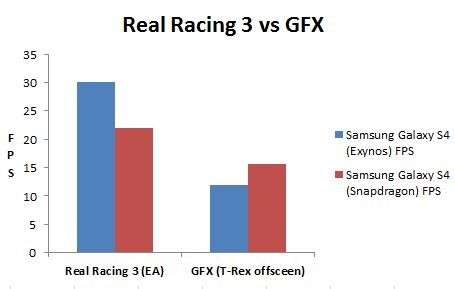
(disparity example)
What we need is a metric that encompasses the ‘usability’ rather than the ‘capability’ of these devices: a way to view them on a unified platform that compares their performance, user experience and battery life on the top and most popular applications. These are the metrics that developers and end users care about.
The solution can’t be yet another synthetic benchmarking app that runs a fixed and predictable load on a phone’s CPU or GPU. These constant, artificial measures can’t keep up with the influx of new games, new game engines, new SDKs and new devices arrive in the Android ecosystem every day. It’s an ecosystem too rich to be covered by one application or one benchmark.
Instead, we need to quantitatively assess the performance and battery drain of devices, periodically, without bias towards any OEM or a specific app, using a platform that does not have room for cheating or manipulation.
At GameBench, we have made first attempt towards such a framework. It allows:
- Developers to use one platform to optimize their games across Android devices
- OEM and chip makers to compare device performance across the top games.
- Customers to make a clear choice based on the ‘real’ performance data collected from several Android devices and published on our cloud-based dashboard
Just to be clear: a usability test or benchmark is one that measures things that normal users care about, while they’re using real-world apps and games. It’s very different to a traditional benchmark that puts a synthetic load on a processor and then spits out a number (which is meaningless on its own) based on how quickly that load was dealt with.
This is real information: unbiased, unadulterated
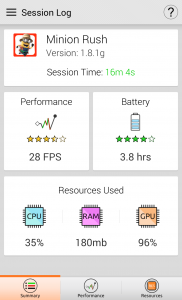
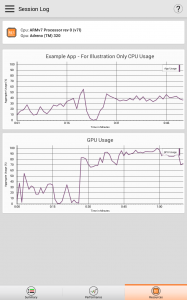
GameBench is getting there. We released an app last week to precisely quantify the performance and battery life of top Android devices and apps. Remember: you have to play your favorite games (or apps) for 15 minutes to see how well the device handles this. At the end of this you will get a summary of the session (s) with detailed metrics and a simple to understand star rating. For example: A 3 star rating on performance and battery is indicative of an acceptable level of device ‘usability’. Having said that, developers and hardware vendors should really target at least a 4 star rating for optimal user experience. Alternately, GameBench also publishes data it collects in lab with this app using independent gaming enthusiasts.
The data shown below is publicly available at pro.gamebench.net and quantifies (and rates) the top devices in the market when playing the popular games. Please login using the following credentials to view it:
- Username: gb
- Password: gb123
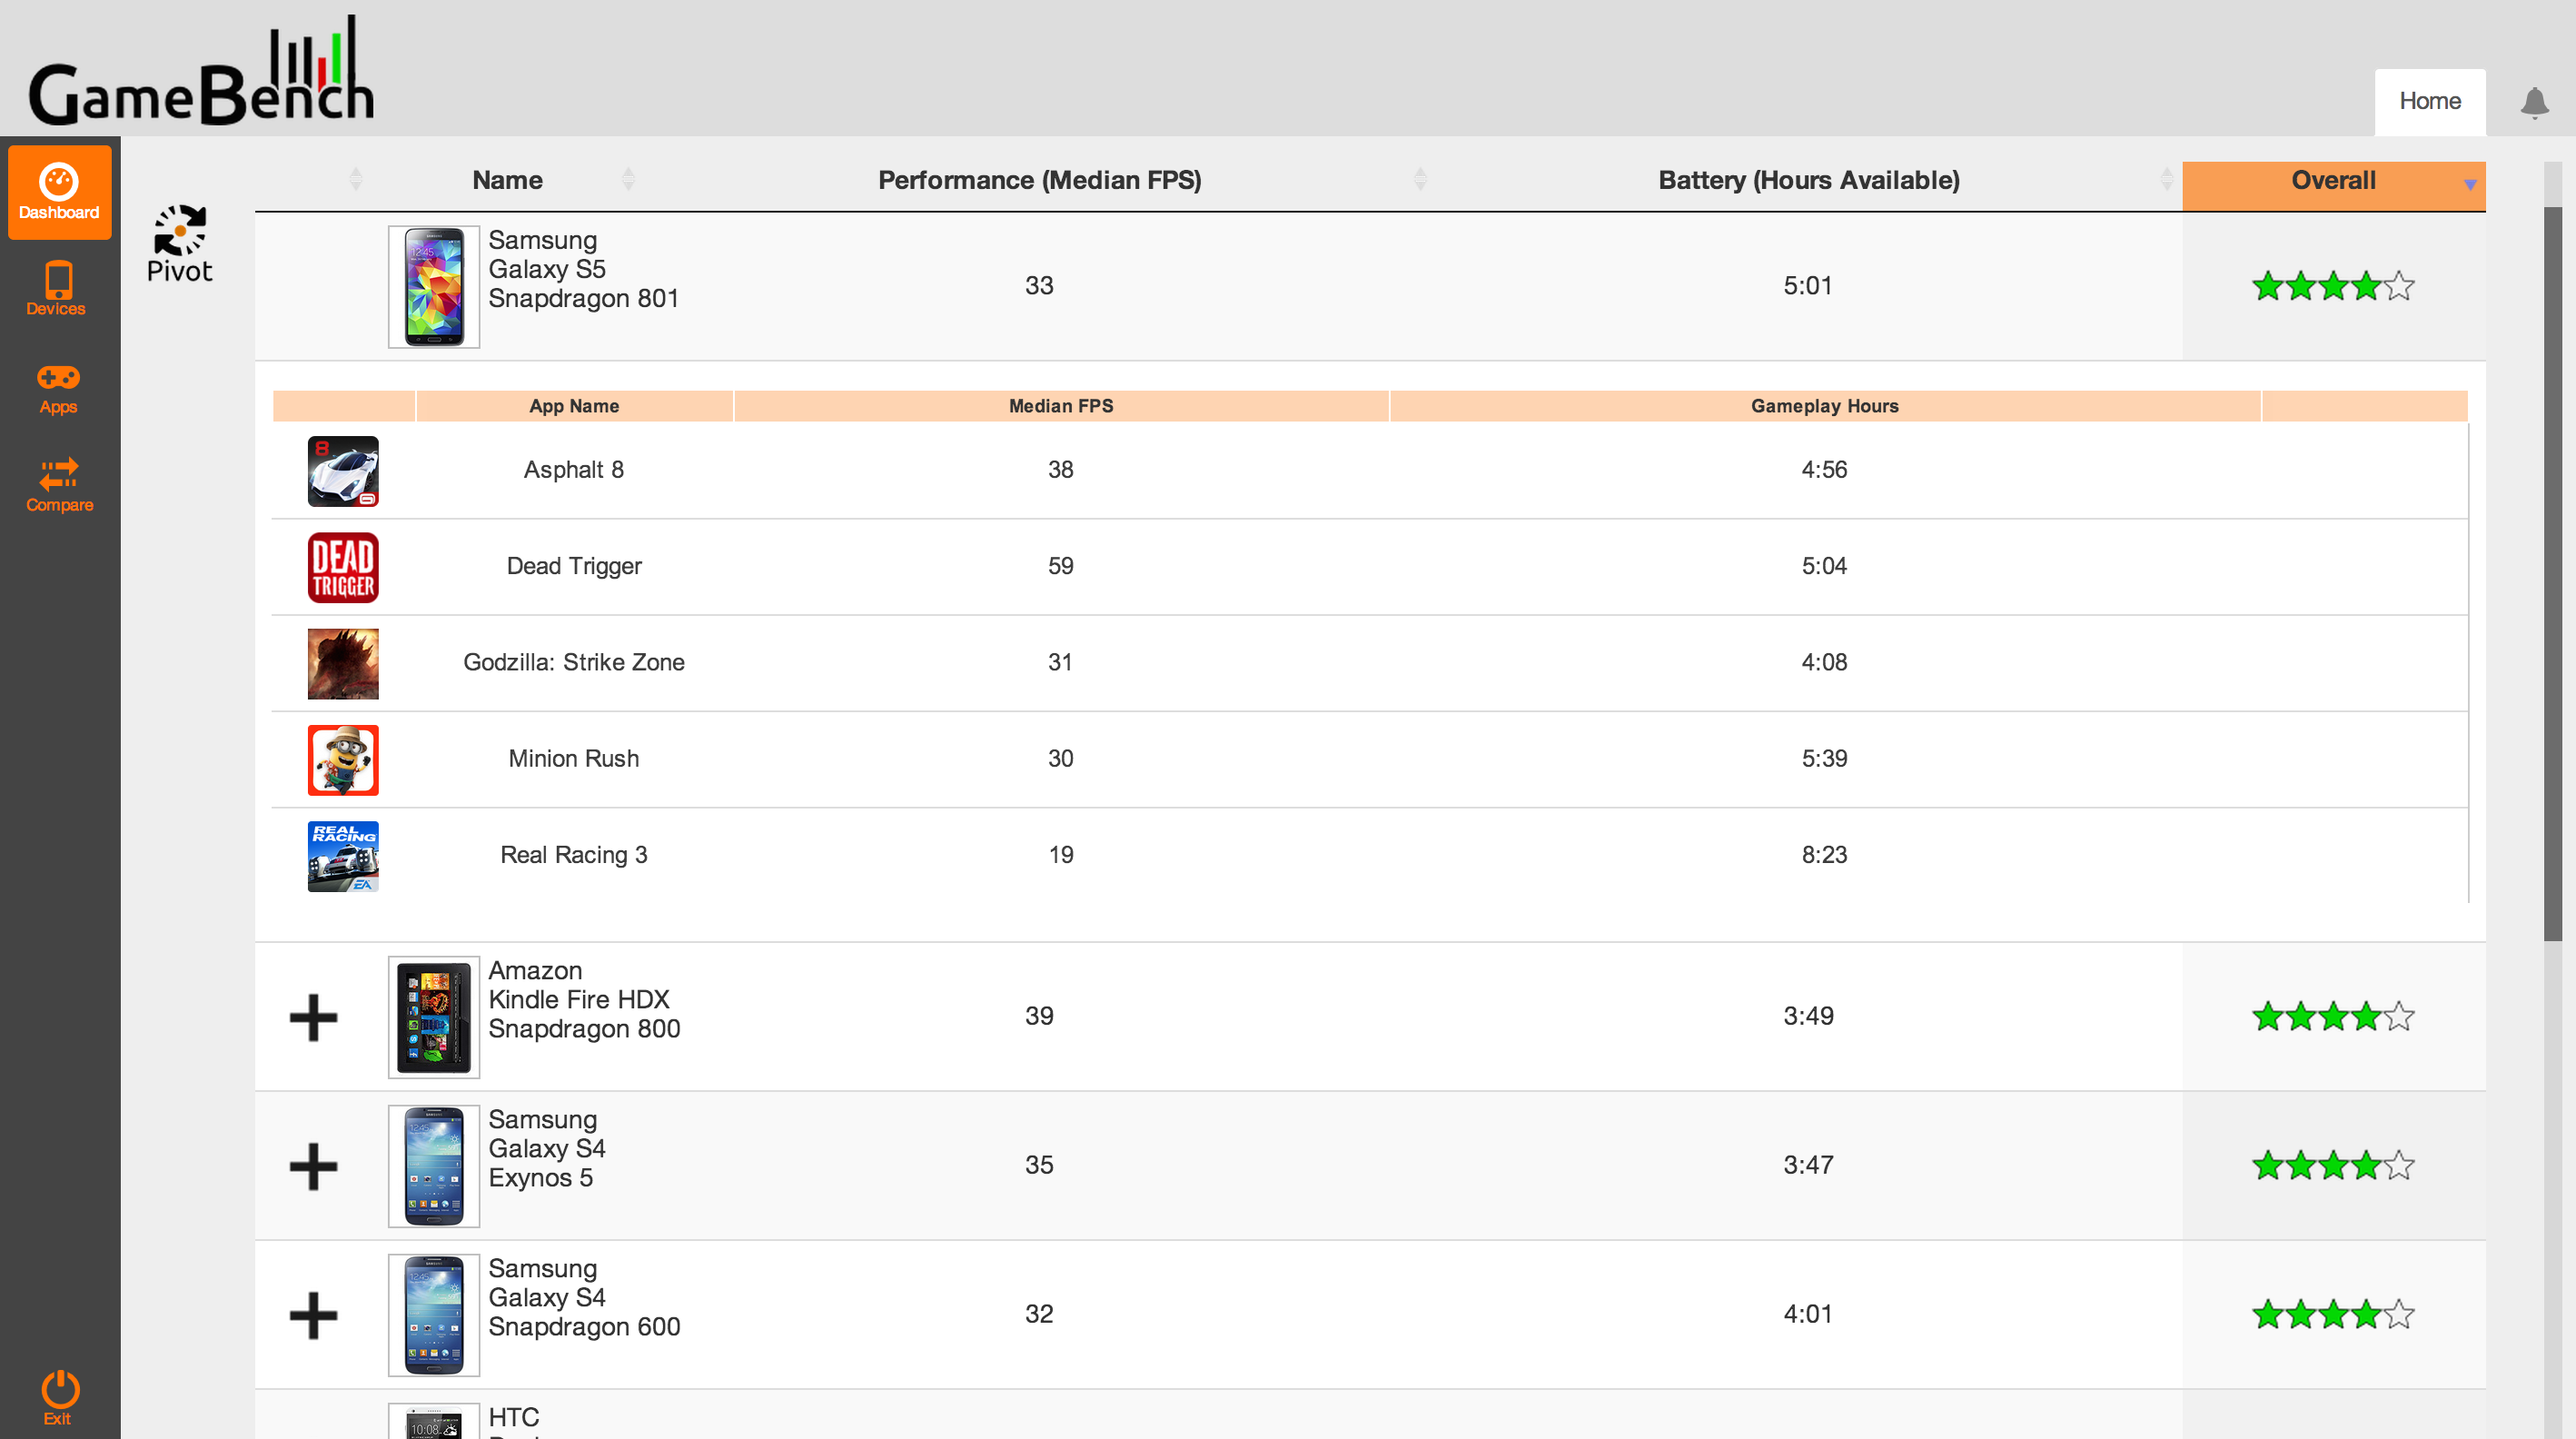
The data indicates the ‘usability’ of the devices on real games. Soon, this table will be expanded to generic, non-gaming apps, but that’s in the future — for now, we’re all about bringing much-needed transparency and accurate data into the Android gaming community.