- GameBench Staff
- 02. July 2019
-
0 Comments
In the previous blog, we looked at the definition of FPS and what tools you can use to measure it on Android and iOS devices. In this blog, we will look at examples of FPS measured using GameBench tools and how they can be interpreted to understand the quality of a gaming session objectively. Before going into additional metrics and how we can spot good/bad gaming sessions, I would like to introduce you to the typical workflow for using the tools to give you more context for the next blog.
GameBench tool workflow
When measuring FPS (or any other metric) using GameBench tools, this is the typical workflow followed by most users:
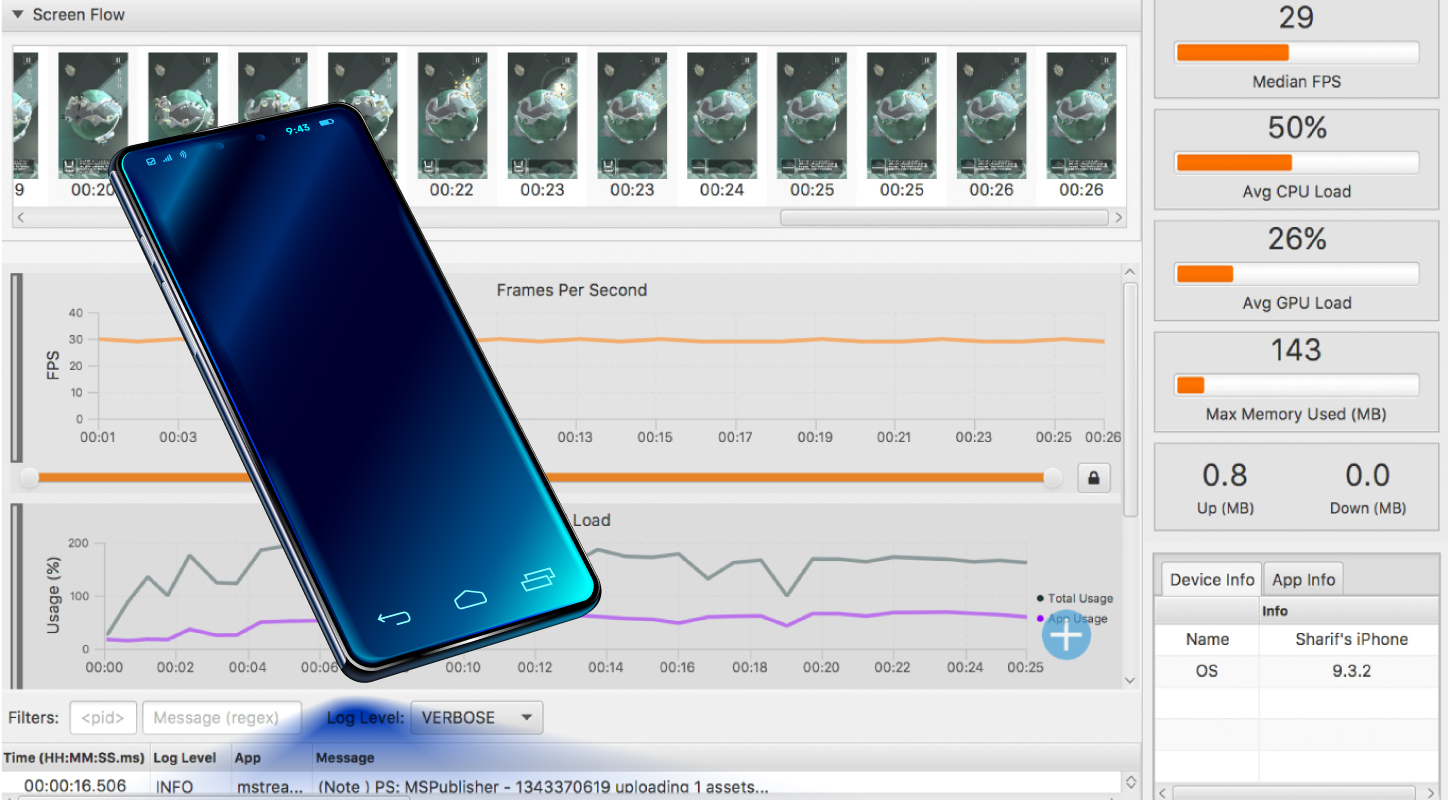
- Download the GameBench Desktop App if you are testing across both Android and iOS;
- If you are only interested in testing an Android game, you can either download the GameBench Community Edition app for Android to feel for performance, or sign up to use the GameBench Pro app to get more detailed metrics;
- Use the GameBench Desktop or Android app on a variety of mobile devices at your disposal and collect performance metrics;
- Upload all the data to the GameBench cloud dashboard if you have signed up for a Pro account;
- Access all your data in the GameBench cloud dashboard to gather insights and compare performance across all the mobile devices you have used in your tests.
Quickly assess performance
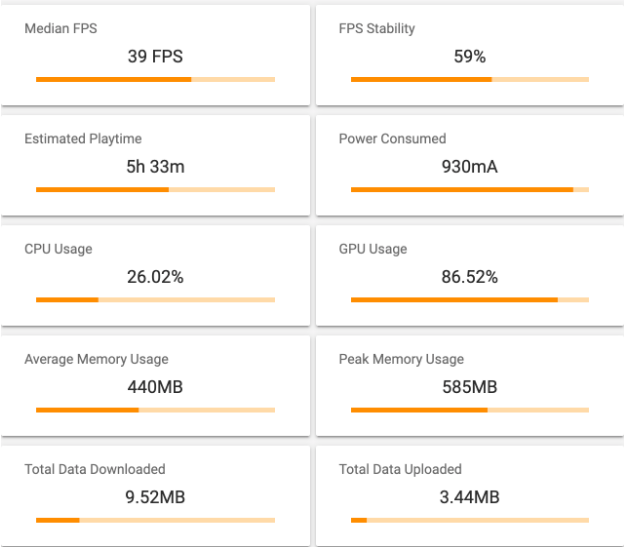
The following snapshot shows the summary of a gaming session uploaded to the web dashboard.

This was a random gaming session I picked up from our dashboard. You can see that at first glance, this is not a good gaming session because of the two metrics at the top of the summary.
Median FPS (39) and FPS Stability(59%) are metrics that clearly tell us why this is the case. Let's look at what these indicators mean and why I concluded that this was a good gaming session.
Median FPS
For Android devices, the GameBench tools know the timestamp of every frame that was rendered on the device and we use this data to compute the FPS for each second of the gaming session. In iOS, we sample the Core Animation instrument to measure FPS. So the entire FPS data for the gaming session is stored in the web dashboard.
The median FPS value is computed by sorting all the values and picking the value in the middle. Median has some very interesting characteristics and that was the reason it was chosen as a key indicator of performance:
- Median FPS shows the most common FPS value in the session;
- The median value is very robust to outliers. E.g if we had a menu screen that was static (0 FPS), but most of the game was running at 60 FPS, the median will not be affected by 0 values (these are called outliers). Average FPS would have included the outlier values (0 FPS for example) and this would drop the value to below 60;
- The Median naturally filters short menu screen sections of a session and focuses on gameplay sections if they are the majority of the time spent by the user while recording the session.
Coming back to the above example, we can see that the median FPS is 39. Going back to the previous blog, we discussed how a typical mobile display refreshes at 60 Hz and so a typical game needs to provide the display with a frame every 16 ms to hit 60 FPS. If it skips one pulse, then we fall back to 30 FPS. This value of 39 means that the game is trying to hit 60 FPS but is unable to do so and as a result some frames take longer than 16ms to render. As a game developer, if your game cannot consistently render in 16ms or less, you should try and stick to 30 instead of targeting 60 and being unable to meet that target every frame. (Other compromise frame rates are possible, such as 40fps and 45fps, but we’re keeping things simple for the purpose of this blog.)
FPS Stability
In addition to the median FPS, it is also be good to know what percentage of time was spent around the median FPS value. For more details on this metric please look here. This metric gives a very good indication if the FPS was fluctuating a lot. A good number to aim for is 80% stability at the very least.
In the above example, we can see that the FPS stability of the session was below 80% and this is an indication that the gaming session was choppy. The web dashboard allows you to look at the frame rate values for the full session and we can clearly see why FPS Stability is quite low for this session at 59%. The orange line in the figure shows the Median FPS and we can clearly see that the actual FPS values fluctuate a lot from the orange line.

Variability Index
In the performance pane, we also display another metric that you should probably track closely to assess game performance. For reference, I have included a snapshot below of all the metrics we are discussing in this blog.

As you can see the Variability Index for this session is 3.84. Unlike the other two metrics we have discussed, the lower this metric the better (closer to 1.0 is what a gaming session should be aiming for).
Let’s spend a little time understanding why this metric has to be closer to 1.0. This describes the average variance between consecutive frame rate readings. In the example shown above, there was an average variance of 4 fps between consecutive readings, which is further evidence that the frame rate was inconsistent. The benefit of this alternative variability metric is that it is independent of the Median FPS, and is, therefore, less likely to punish changes in frame rate that were deliberately intended by the developer.
Summary
As explained above you can quickly assess the performance of a gaming session based on the following:
|
Metric |
What is good? |
|
Median FPS |
60 - Best, 30 - Good |
|
FPS Stability |
Aim for 80% or more |
|
Variability Index |
Aim for a number closer to 1.0. Numbers greater than 2.0 generally indicate an unstable framerate. |
Example sessions
In this section, we will look at some of the gaming sessions in the web dashboard and will use the information in this section to assess their quality.
Session 1: Minion Rush on the Honor 10
The session can be found here. We have used markers on this session (find those here). Looking at the summary below, we can see that at first glance, it looks to be a great session.

Let’s ensure it is by looking one level deeper using the Variability Index in the performance pane. The variability value also is closer to 1.0 as we wanted it to be. So we are good from that aspect too.

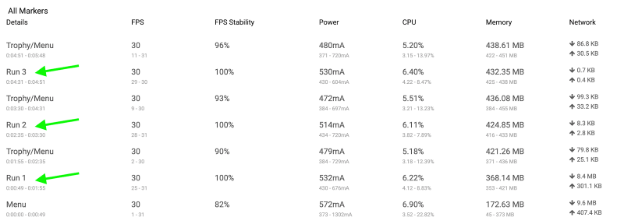
One key observation is that these metrics are computed for the complete session. Let's also look at the numbers for the marked areas.

Further confirmation here that this session had great FPS and stability for the marked runs as shown above.
What Next?
Frame rate and frame time analysis using tools like GameBench can provide critical data on game quality for the benefit of Quality Assurance teams, developer teams and product managers. If you’d like to get some data for your own chosen games or devices, please download the GameBench Community Edition (free) or use GameBench Pro (paid) for Android, or the GameBench Desktop App (paid) for Android and iOS.
Want to learn more? Follow us to the next blog in this series where we take a deeper dive into Janks and frametime testing.

